Incomparable Knowledge
of GIS
From LiDAR to Cardastral Services & ORTHO, GIS to BIM & Remote Sensing, we understand the complex decision-making process.
From LiDAR to Cardastral Services & ORTHO, GIS to BIM & Remote Sensing, we understand the complex decision-making process.
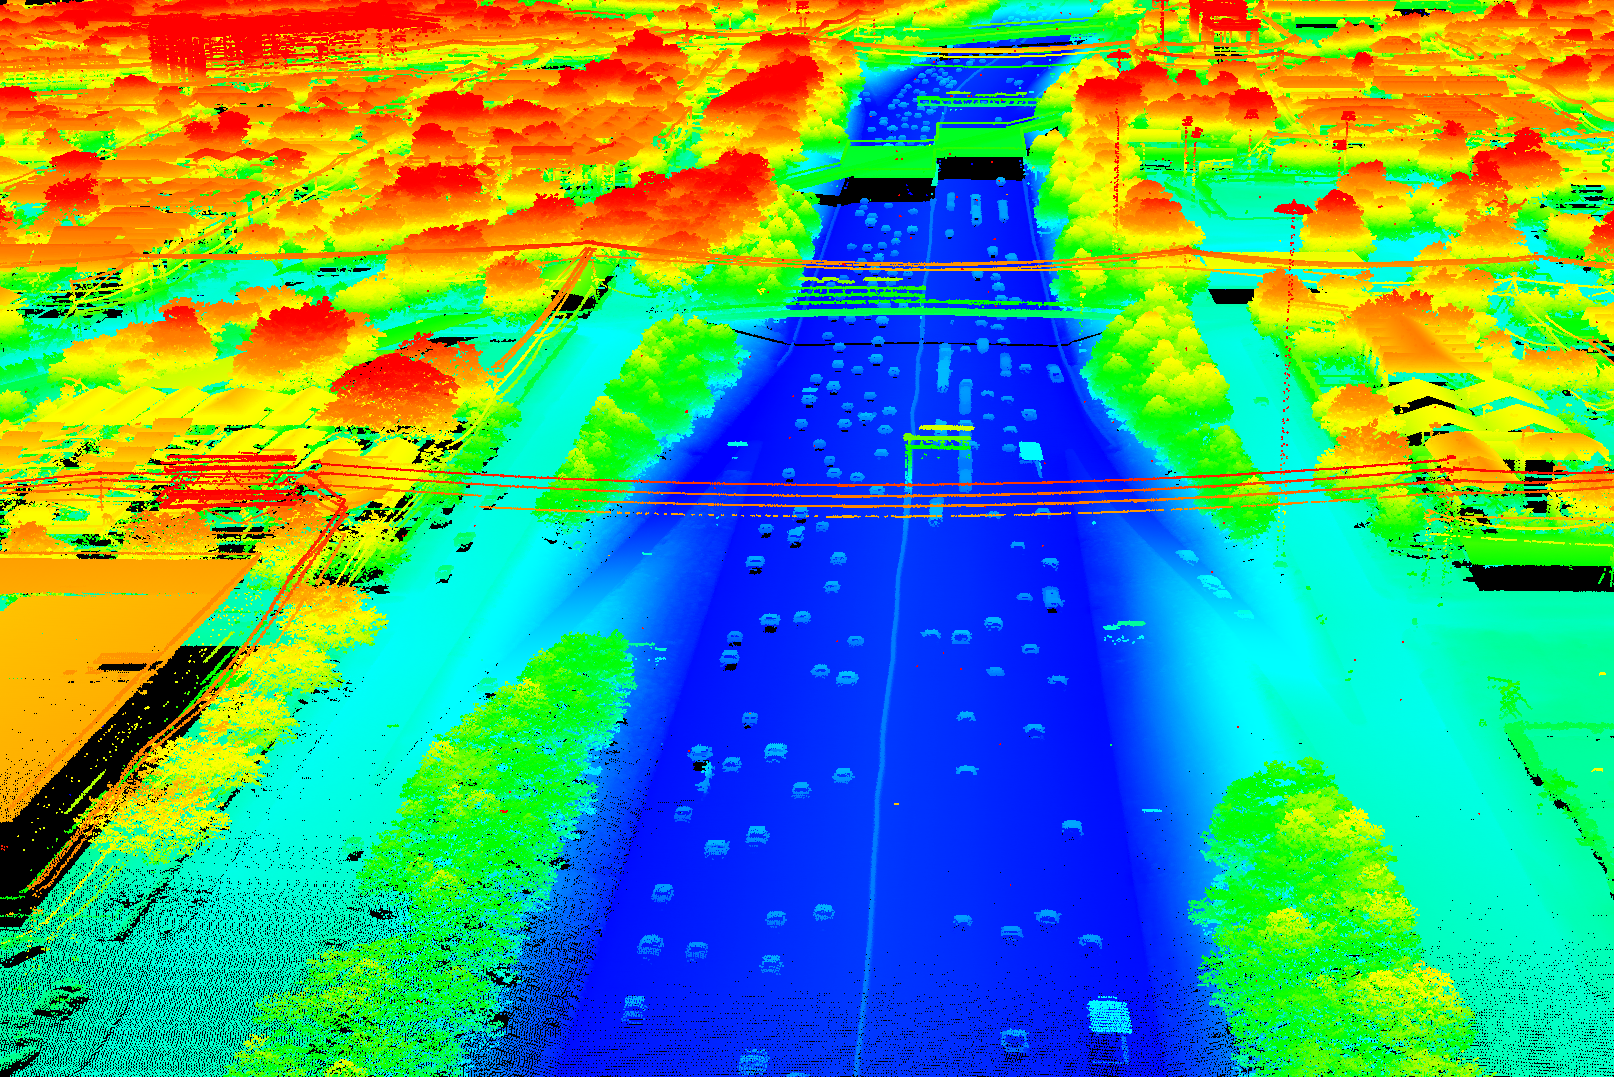
LIDAR is a remote sensing technology used to measure distances and create precise, three-dimensional maps of the Earth's surface and its features. How LIDAR Works : LIDAR operates by emitting laser pulses towards a target and measuring the time it takes for the reflected light to return to the sensor. This time-of-flight measurement allows for the calculation of distances with high accuracy. The data collected results in a dense point cloud, which represents the shape and structure of the scanned environment. Applications of LIDAR LIDAR technology has a wide range of applications across various fields, including: Topographic Mapping: LIDAR is extensively used to create detailed topographic maps, which are essential for land use planning, environmental monitoring, and resource management. Forestry and Vegetation Analysis: It helps in assessing forest structure, tree height, and biomass, making it valuable for ecological studies and forest management. Urban Planning and Infrastructure: LIDAR is used for mapping urban environments, including buildings, roads, and utilities, aiding in city planning and infrastructure development. Autonomous Vehicles: LIDAR plays a crucial role in the navigation and control of autonomous vehicles by providing real-time data about the surrounding environment. Disaster Management: It is employed in assessing natural disasters such as floods, landslides, and volcanic eruptions, helping in emergency response and recovery efforts. Archaeology: LIDAR has been instrumental in discovering and mapping archaeological sites that are obscured by vegetation, revealing structures that are otherwise hidden. Coastal and Oceanographic Studies: Bathymetric LIDAR is used to measure underwater features and monitor coastal changes, providing valuable data for marine research.
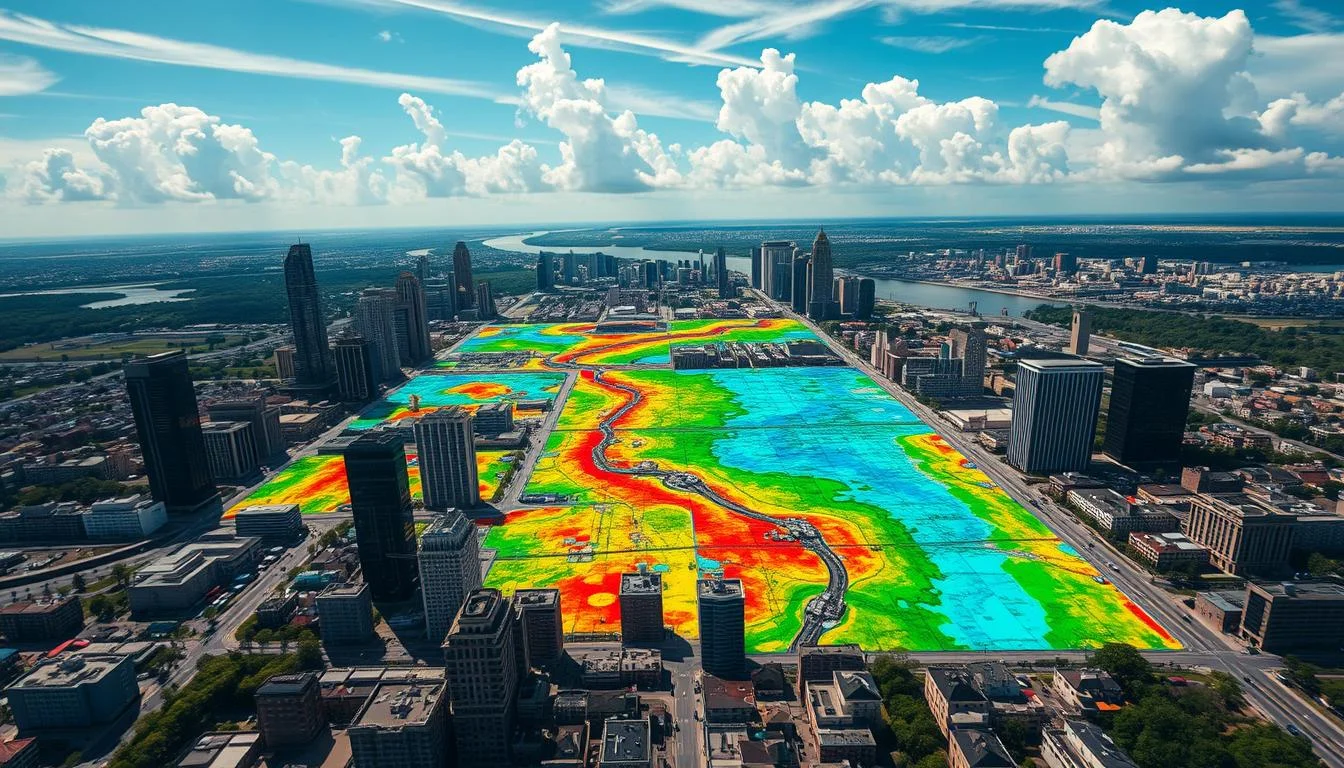
This image using professional GIS terminology:
3D Urban Modeling: Represents building footprints as extruded vector data for spatial analysis.
Raster Overlay: A thematic layer (heat map) showing continuous data like flood risk or urban heat.
Topographic Visualization: Uses a graduated color ramp to show elevation and surface intensity.
Spatial Analysis: A tool for urban planners to visualize how environmental factors interact with city infrastructure.
Raster Data Model: The colorful overlay is a raster layer, consisting of a grid of cells (pixels), where each cell contains a specific value. In this context, the colors likely represent a continuous phenomenon such as surface elevation (DEM), urban heat intensity, or flood depth.